
Has there been an increase in potential residency in Philadelphia?
Analyzing Zoning Density Changes, 2012–2017
Tagged:
Zoning
Urbanism
Philadelphia
Data Science
In contrast to my last entry, I figured I should provide a counterexample to Betteridge’s law of headlines.
About a week ago, Jon Geeting posted an inquiry to the Code for Philly #project-ideas
Slack channel
asking,


I had recently been toying with another mapping-related side-project (which is not yet complete and therefore I’ll have to leave you in suspense), so I offered Jon my assistance.
In the remainder of this article, I first describe the regulatory reforms that have occured over the past five years in the Philadelphia zoning code, and why they render before-and-after zoning change analysis challenging. I then describe my technical approach to overcoming the challenges, which will likely only appeal to computer scientists; you can feel free to skip that section unless you plan on reusing, extending, or repurposing my code. Finally, I conclude with the preliminary results of my analysis.
Primer on Philly Zoning Reform
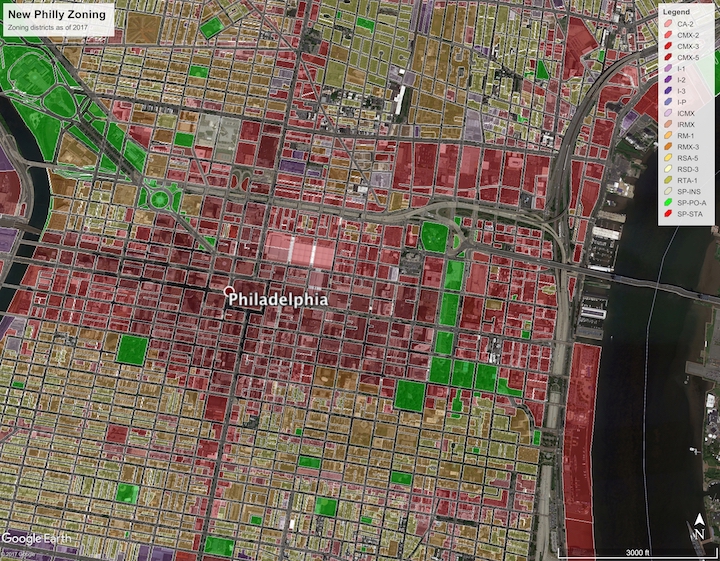
In 2012, Philly’s zoning code underwent an overhaul that basically amounted to a complete rewrite. Prior to that, the zoning code hadn’t been touched for the previous 50 years. The number of zoning district types decreased by over a third, and the rules regulating them were significantly simplified and deobfuscated.
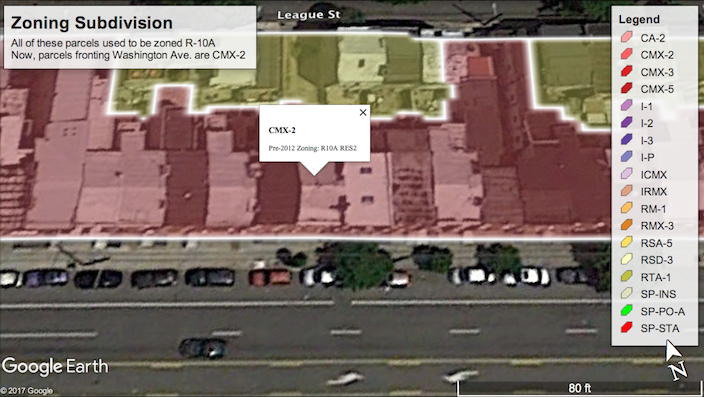
Over the past five years, the borders of many zoning districts were redrawn; some of this may have even occurred instantaneously when transitioning from the old zoning code to the new. For example, the 600 block on the North side of Washington Avenue used to be zoned R-10A, but is now subdivided: The interior parcels have been split into a separate RSA-5 (single family row home) district and those fronting Washington Avenue have been rezoned into CMX-2 (mixed-use). The corner parcel at 7th street is now RM-1 (multi-family residential). Likewise, the 500 block used to almost entirely be zoned R-10, but is now a mixture of RM-1 fronting 6th street.
Furthermore, the GPS coordinates of the zoning districts for the pre-2012 and post-2012 datasets on Open Data Philly don’t always line up. So, even if a zoning district’s borders didn’t change, the GPS coordinates of its new boundary might not be identical to its pre-2012 boundary. Therefore, there is not a straightforward way of mapping old zoning districts to new ones, even using automation.
Even if the zoning boundaries did line up perfectly, there are over thirty thousand zoning districts in Philly: Mapping old districts to new ones using a naïve approach will require making over one billion “Does this old district line up with this other new one?” comparisons. Even if a human could do one comparison per second working eight hours per day, he or she would require close to a hundred years to complete the mapping. By then, there’s a good chance there might be another change to the zoning code 🤣! Even if a computer could do a hundred comparisons per second, it would take about four months non-stop to complete. So, how did I complete the mapping in less than a day? I answer that in the following section. But if you’re impatient and just want to skip to the analysis, it’s safe to skip ahead.
Technical Approach
Here’s a rough outline of the naïve algorithm I mentioned above:
| 1: | procedure Merge-Zoning($Z$, $Z^\prime$) |
| Require: $Z = \{D_1, D_2 \ldots\}$ is a set of the old zoning districts, each being a list $D = \{p_{1}, p_{2}, \ldots\}$ of its boundary points. $Z^\prime$ is the list of new zoning districts. | |
| Ensure: $M = \{ I_1, I_2, \ldots \}$ is a set of merged zoning districts, where each $I \in M$ is a tuple $\langle i, \{ j_1, j_2, \ldots \}, \{ D_1, D_2, \ldots \}$ with the first element containing the index $Z^\prime_i$ of the new district, the second element containing the set of old districts $\{Z_{j_1}, Z_{j_2}, \ldots\}$ it subsumes, and the third element containing its new boundary. | |
| 2: | for all $D_i^\prime \in Z^\prime$ do |
| 3: | for all $D_j \in Z$ do |
| 4: | if $D^\prime \cap D \neq \emptyset$ then |
| /* The zoning districts intersect */ | |
| 5: | $J \gets \{j$ for all $j$ in all preexisting districts in $D_j \in M$ that intersect with $D_i^\prime\}$ |
| 6: | Append $\langle i, J \cup \{ j \}, D_i^\prime \cap D_j \rangle$ to $M$ |
| 7: | end if |
| 8: | end for |
| 9: | end for |
| 10: | end procedure |
Using a combination of Shapely and pyproj makes things like intersecting polygons (i.e., zoning district boundaries) and calculationg the area inside polygons easy.
I’m not sure which algorithm Shapely uses for polygon intersection, but its computational complexity is likely $\Omega((n\times m)\log(n\times m))$, where $n$ and $m$ are the number of edges in the polygons being intersected. The zoning districts have on average 39 edges, so that means a single intersection is going to take at least 5000 operations. Therefore, it’s not realistic to hit the afforementioned speed of a hundred automated comparisons per second. (In fact, my final implementation ended up averaging about two seconds per comparison.)
The first optimization we can make stems from the observation that zoning districts are non-overlapping. Therefore, any portion of an old zoning district that overlaps with a new zoning district can be deleted once they are merged:
| 1: | procedure Merge-Zoning($Z$, $Z^\prime$) |
| 2: | for all $D_i^\prime \in Z^\prime$ do |
| 3: | for all $D_j \in Z$ do |
| 4: | if $D^\prime \cap D \neq \emptyset$ then |
| /* The zoning districts intersect */ | |
| 5: | $J \gets \{j$ for all $j$ in all preexisting districts in $D_j \in M$ that intersect with $D_i^\prime\}$ |
| 6: | Append $\langle i, J \cup \{ j \}, D_i^\prime \cap D_j \rangle$ to $M$ |
| 7: | $D_j \gets D_j \setminus D^\prime_i$ |
| 8: | if $D_j = \emptyset$ then |
| /* The old district is fully contained within $D^\prime_i$ */ | |
| 9: | break |
| 10: | end if |
| 11: | end if |
| 12: | end for |
| 13: | end for |
| 14: | end procedure |
The final optimization that gets the running time down to tens of
hours instead of days is to get rid of the cumbersome $J$ calculation
using some clever caching. If you’re interested, check out intersect_maps.py in my code.
I could probably reduce the computation time by another order of magnitude by more intelligently pruning old zoning districts, e.g., by storing them in a datastructure like an R-Tree. I chose not to do that because it would have required more development time, and the existing computation time of “less than a day” was sufficient. I may add that feature in the future.
Preliminary Analysis Results
At this point we have merged the old zoning districts with the new, producing a KML file which can be loaded into Google Earth to interactively explore the zoning changes. You can download it here.
Structural Density
The first thing I’d like to discuss is what I call structural density. (I’m a Computer Scientist, not a City Planner, so please excuse me if I’m not using the correct terminology.) I wanted to know: What is the maximum amount of square feet of building the zoning code would allow to be built on a parcel if whatever’s currently there were replaced? I calculated the structural density metric for both pre-2012 and post-2012 zoning.
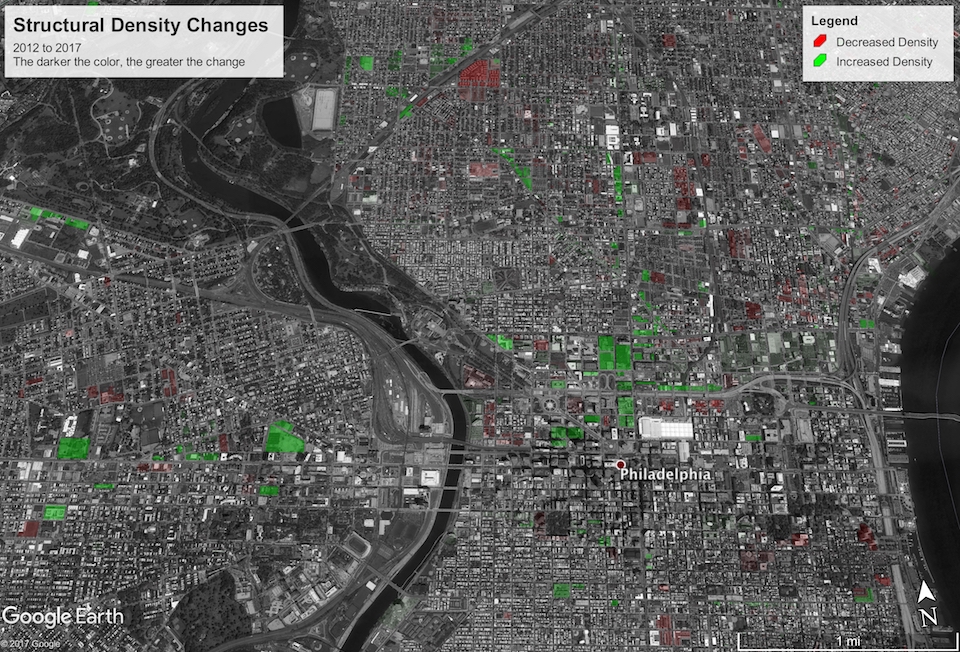
The results turned out to be less interesting than I had hoped; you can download the KML file here. The overall square footage capacity of the city has increased with the new zoning code by over 38 million square feet, which might seem like a lot, but that only constitutes about one half of one percent change. Most of the changes seemed to emanate from the reduction in the number of zoning district types, so old zoning districts without a good modern analogue either had to be “rounded down” or “rounded up.”
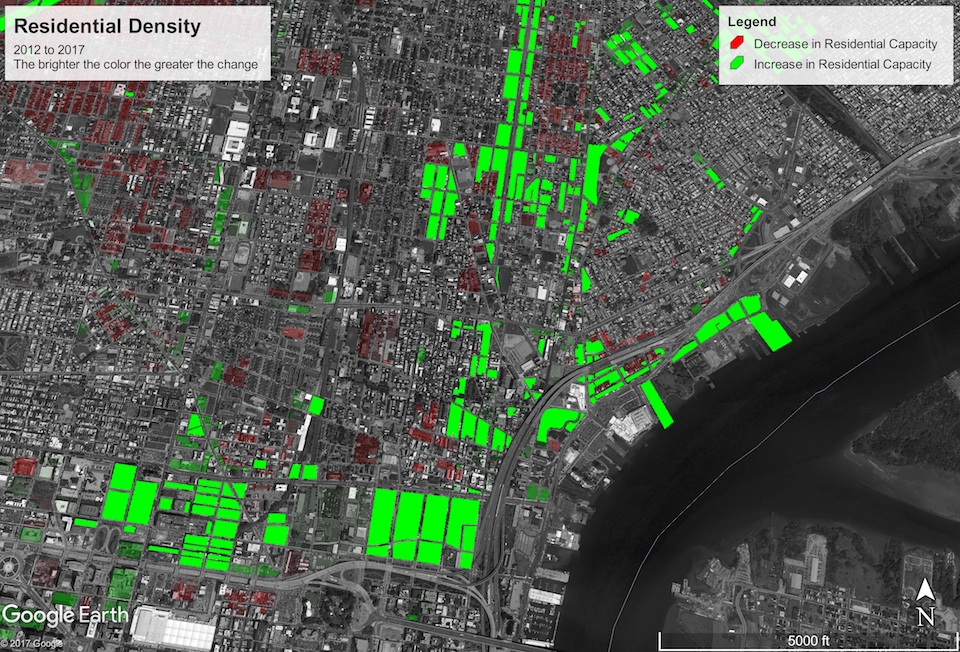
Residential Density
The next metric I investigated was what I call residential density: an upper bound on the number of residents a parcel can support. This is of course poorly defined, because the zoning code itself doesn’t explicitly limit residency. I describe my methodology and parameterization for estimating it in the following section.
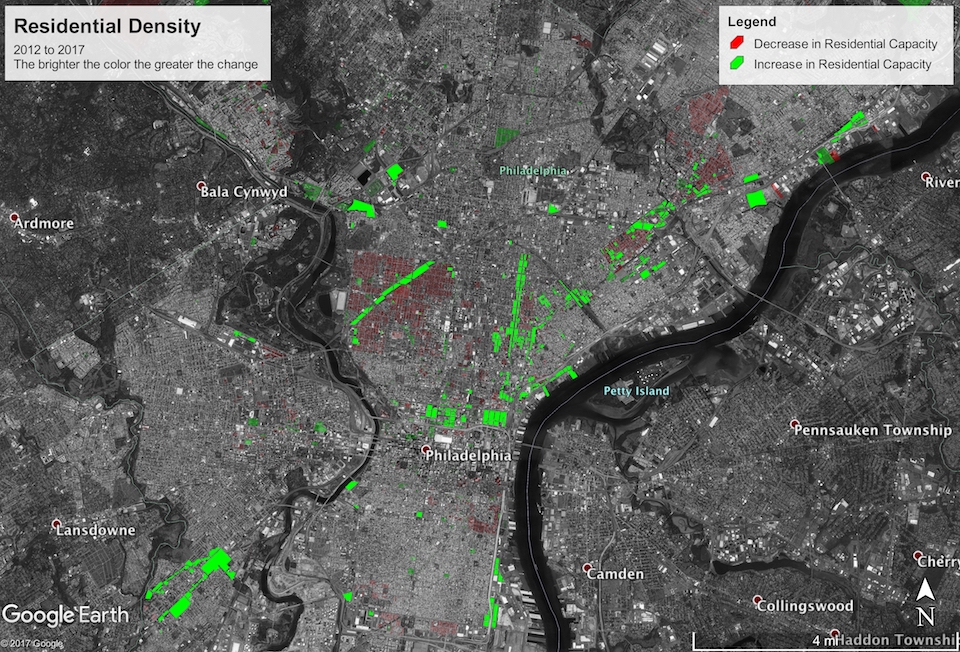
You can download the KML file for this map here. The residential capacity of the city increased by about 386 thousand (~7%) from a maximum of 5,229,657 in 2012 to a maximum of 5,615,158 today. Assuming the population grows at a steady but slow rate of 0.4% per year, it will take at most $$\frac{\log\frac{\mbox{residential capacity}}{\mbox{current population}}}{\log(1 + \mbox{growth rate})} = \frac{\log\frac{5615158}{1567872}}{\log 1.004}\approx 320\ \mbox{years}$$ before the city will reach maximum residency under the current zoning regulations. You heard it here first, folks! Time to get the ball rolling with a new Zoning Code Commission so we’re prepared for 2337!
Seriously, though, there are some other interesting patterns in the map. There are a few clusters of down-zoning and reduced residential capacity around the city, particularly in Strawberry Mansion/Brewerytown, Queen Village/Southwark, deep South Philly, Kensington, Harrowgate, and Frankford. The majority of these seem to be due to old R-10 parcels (which permitted multi-family use) being re-zoned RSA-5, which only permits single-family use. This primarily happened in preexisting single family townhouse communities that aren’t likely to be redeveloped any time soon. But re-zoning from R-10 to RSA-5 will constitute a 60 to 70% reduction in residential capacity of a typical parcel.
With that said, across the board and even within the down-zoned clusters, there are pockets of up-zoning, almost exclusively around large retail corridors like American street. This is thanks to up-zoning to newly created mixed-use districts like CMX and IRMX.
Callowhill, NoLibs, Fishtown, and the river wards were the standout beneficiaries of mixed-use up-zoning, with an excess of what were previously G-2 (medium density industrial) districts that have now become a mixture of CMX, IRMX, and RMX.
Methodology and Caveats
The Internet tells me that the average number of residents per household in Philadelphia is 2.35. (Someone should double-check that with the latest census.) I also assume that the minimum space per resident is 450 sqft.; lowering that requirement will increase the maximum residency estimates for multi-family homes. For districts that only permit single family homes, I say that their maximum residency is 2.35. Likewise, for duplexes: 4.7. For zoning districts that have a maximum height/floors and a minimum percentage of the lot that must be open (e.g., R-10 and RM-1), I calculate the maximum residency as: $$\frac{(\mbox{Lot Area}) \times (1 - \mbox{Minimum Open Area Percentage}) \times (\mbox{Maximum Floors})}{450\ \mbox{sqft.}}.$$ For districts with a Floor Area Ratio (FAR, e.g., R-11 and RM-2), I calculate the maximum residency as: $$\frac{(\mbox{Lot Area}) \times (\mbox{FAR})}{450\ \mbox{sqft.}}.$$ Finally, I round the maximum residency down to the greatest multiple of 2.35.
The old zoning code had a nice series of tables that let me easily determine the parameters for most zoning district classes such that I could estimate maximum residency. However, not all of the zoning classes were covered! I didn’t have time yet to pore over the pages and pages of fifty-year-old legalese to grok the parameters for the missing classes, so instead I used a relative mapping from old zoning classes to new zoning classes that is provided in the new zoning code. Here are the missing zoning classes and their mappings:
| C1 | → | CMX-1 | L1 | → | I-1 | |
| C2 | → | CMX-2 | L2 | → | I-1 | |
| OC | → | CMX-2 | L3 | → | I-1 | |
| C3 | → | CMX-3 | L4 | → | ICMX | |
| C4 | → | CMX-4 | L5 | → | ICMX | |
| C5 | → | CMX-5 | G1 | → | I-2 | |
| LR | → | I-3 | G2 | → | I-2 |
For zoning districts with bonuses, I always assume that the maximum bonus is achieved when making residency and square footage estimates.
Be mindful that we have to take some of these changes with a grain of salt, because they affect large preexisting planned communities/neighborhoods that weren’t before and aren’t now likely to be redeveloped. For example, the theoretical maximum residency of the Society Hill Towers dropped by over 50%, but they ain’t going anywhere anytime soon.
If you’d like to help out or just follow our progress, feel free to
join the newly created Code for Philly #zoning
Slack channel.