
Social Signals
or, the basis for an article that was nominated for best paper and subsequently rejected.
Tagged:
Math
Research
Software
Stories
Introduction
Looking back on my previous job at The Johns Hopkins University, I am struck by and grateful for the breadth of different topics I was able to research: distributed phased array radar resource scheduling, Linux kernel integrity monitoring, TLS, hypervisors, probabilistic databases, streaming algorithms, and even some DNA sequencing, just to name a few.
Toward the end of my—to abuse an overloaded term—tenure at JHU/APL, I became involved in their social media analysis work. For example, I had some success creating novel algorithms to rapidly geolocate the context of social media posts, based solely upon their textual content. But one of the most interesting things I encountered along these lines was a phenomena that we came to call Social Signals.
Discovery of Social Signals
As will become evident from the following chronology, I was not party to this line of research until after many of the initial discoveries were made, so my account of the earlier details may be inaccurate. To my knowledge, however, this is the first time any of these discoveries have been made publicly available in writing.
In 2011, my colleague Clay Fink had been mining Twitter for tweets for quite some time. He had gigabytes of them, spanning months and covering various worldwide events like the London riots, the Mumbai bombings, the Tuscaloosa—Birmingham tornado, the Christchurch earthquake, the Nigerian bombing, &c. These provided a very interesting and, as it turned out, fruitful source of data to research. They shared the common theme of being crises, yet they were each of a very different nature, e.g., some were man-made and others natural disasters.
Clay had created some algorithms to process the mass of textual data, but there was no good, usable way for a human to sift through it to do manual analysis. Step in another colleague, Jaime Montemayor, who created a data exploration tool called TweetViewer.
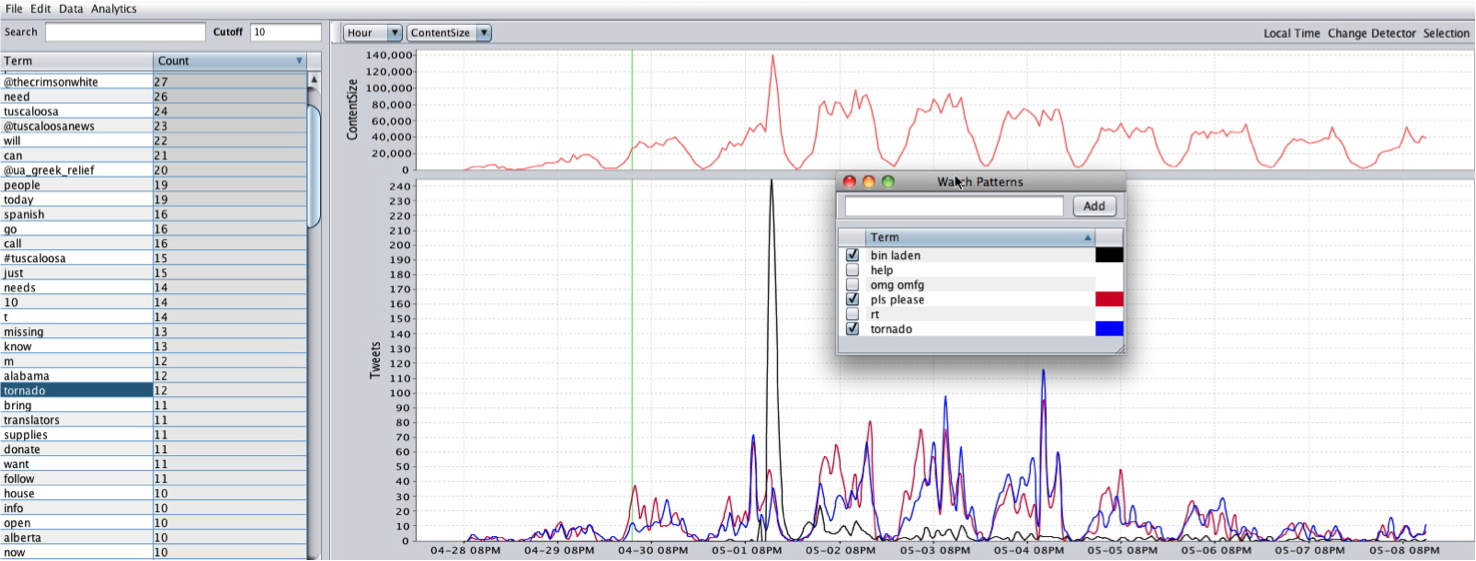
TweetViewer is very simple in concept: It plots the relative term frequencies used in a text corpus over time. Yet this simple concept—coupled with the algorithms and HCI workflow accelerators (as Jaime calls them) behind-the-scenes that allow real-time interaction with and instantaneous feedback from the data—enabled some interesting disoveries. Take the large spike in Twitter traffic around May 2nd as an example: it corresponds to the killing of Osama bin Laden—the event associated with the highest sustained rate of Twitter traffic up to that point. Selecting the term “bin Laden” instantly generates its time series in the lower graph, which correlates perfectly with the spike in overall traffic.
This example perfectly illustrates one of the challenges of social media analytics, for there were three other major events being concurrently discussed on Twitter that were masked by the popularity of the bin Laden killing: the British royal wedding, a $100k fine levvied on Kobe Bryant, the NBA finals, and a tornado that devastated several cities in the Southern United States. Monitoring "trending topics" based upon spikes in the frequency or popularity of terms would not detect these less popular topics of discussion.
By exploring Clay's corpora in TweetViewer, he and Jaime quickly noticed a pattern: there were certain terms that always seemed to spike in frequency during a crisis event. These included "help," "please," and "blood," as well as various profanities. In the Nigerian bombing corpora, for example, there was a large spike in Twitter traffic temporally correlated with the bomb explosion, and a subsequent spike minutes later correlated with a bomb scare (but no actual blast). The frequency timeseries for the term "blood" pefectly correllates to the actual bomb blast, but does not spike again during the bomb scare. Clay and Jaime dubbed these terms Social Signals.
Automating the Process
When I was first briefed on this phenomenon I was immediately intrigued, primarily around the potential of publishing an academic paper peppered with legitimate use of profanity.
…
Nam castum esse decet pium poetam
ipsum, versiculos nihil necessest;
…
The challenge was that these social signals were discovered by humans. Were there others we had missed? Would this phenomenon extend to languages other than English? Could an algorithm be designed to classify and track social signals?
I played around with the data in TweetViewer for a while, and I eventually developed a theory as to what made a term a social signal. My underlying hypothesis was that the human-identified social signals are a subset of a larger class of abnormal terms whose frequency of usage does not correlate with the overall frequency of Twitter traffic. For each geographic region, Twitter traffic ebbs and flows in a pattern much like a circadian rhythm. In the Twitter posts captured from the Tuscaloosa tornado event, for example, traffic peaks around 23:00 every night and then rapidly falls—as people go to sleep—and reaches a nadir at about 09:00—when people are arriving at work. It is actually very regular, except for when people are discussing an unexpected event.
As an example, consider the terms "please" and "blood," which we have observed to temporally co-occur with certain types of disaster events. Under normal circumstances these terms are not temporally correlated to each other; however, during a disaster scenario they are. Furthermore, the term "blood" does not have a very high frequency, so methods based strictly on the frequency domain or burstiness of the terms might ignore that signal. Therefore, we first identify the set of maximally abnormal term signals, vi&., those that are temporally uncorrelated with the overall Twitter traffic. Next, these abnormal signals are sorted according to a significance metric which is based on how temporally correlated they are to each other. Finally, an unsupervised graph clustering algorithm is used to merge similar signals.
For the sake of brevity, I am going to save the technical details for a later post. I will likely also be publishing a related manuscript on the arXiv.
Results
We evaluated our approach on a number of Twitter datasets captured during various disaster scenarios. The first corpus we examined includes tweets from the April 2011 tornados in Tuscaloosa, Alabama. This is the interesting corpus mentioned above in which the tornados co-occurred with the British Royal wedding, a much discussed $100,000 fine of NBA player Kobe Bryant, and the killing of Osama bin Laden—the event associated with the highest sustained rate of tweets per second to date. The second corpus includes tweets from the February 2011 earthquake in Christchurch, New Zealand. The final corpus includes tweets leading up to and including the July 2011 bombings in Mumbai, India. This corpus is interesting because it includes tweets from the prior thirteen days leading up to the bombings.
The time bucket size was set to 20 minutes. The number of maximally aberrant signals discovered was 300. For each corpus, the resulting automatically detected signals included the human-identified social signals “help” and “please.” The Mumbai corpus also included the “blood” social signal. The clustered signals of highest significance are given in the following table, in which green signals are ones that are clearly related to an important event:
| Dataset | Start Date | End Date | # Tweets | # Terms |
|---|---|---|---|---|
| Tuscaloosa | April 28, 2011 15:46:35 CDT | May 8, 2011 21:43:48 CDT | 97409 | 58232 |
Top Detected Signals (sorted by decreasing significance)
tuscaloosanews greek relief need disaster followers text tell redcross like needs just back alabama tornado laden osama news dead obama know tuscaloosa really come thanks will help youtube helpttown right right love lakers think supplies mothers mother happy first volunteers give spann time donation make donate please courtside tickets
|
||||
| Christchurch | February 17, 2011 23:10:03 NZDT | February 24, 2011 11:51:11 NZDT | 12973 | 15223 |
Top Detected Signals (sorted by decreasing significance)
need safe #eqnz earthquake still people know help please chch family anyone christchurch will quake #chch jobs #job canstaff victims darkest donate zealand towards donation make redcross just today power thanks everyone news home thank water christchurchcc open yeah tumblr photo another bexielady haha dairy nzne wellington nzpa #christchurch want
|
||||
| Mumbai | July 1, 2011 21:39:06 IST | July 15, 2011 03:29:30 IST | 164820 | 123516 |
Top Detected Signals (sorted by decreasing significance)
need govt terror good every people varsha love twitter thanks hear time help please police anybody says serious right work control mumbai karia going think blood like #mumbai injured kasab will even make hospital room blasts stop home call parents blast today well looking life india dadar want just safe #mumbaiblasts stay news rahul come indian #here back know take anyone spirit also #bse #stocks #tips turn following sexy #instantfollow bitch #images #india #free
|
||||
The Aftermath
Excited that we had developed an automated, completely unsupervised, language-agnostic technique for detecting social signals—which also happened to detect the same signals discovered by human analysis—we quickly wrote up a paper and submitted it to a conference. A few months later the reviews came back:
Reviewer 1
Accept Nominate for Best Paper
Reviewer 2
Accept
Reviewer 3
Reject
As you might have guessed, the paper was ultimately rejected.

Shortly after, I left JHU and didn’t continue this line of research, so it’s just been bit-rotting for the past few years.
In summary, our paper introduced the discovery of social signals: elements of text in social media that convey information about peoples’ response to significant events, independent of specific terms describing or naming the event. The second contribution of the paper was a model of the mechanisms by which such signals can be identified, based on the patterns of human-identified signals. Finally, a novel unsupervised method for the detection of social signals in streams of tweets was presented and demonstrated. For a set of corpora containing both natural and human-caused disasters, in each instance our model and algorithms were able to identify a class of signals containing the manually classified social signals.
Future work includes optimizing the algorithms for efficiency in processing streaming Twitter traffic. Incorporating estimates of provenance and trustworthiness from the Twitter social network, as well as accounting for the propagation of signals through re-tweets, might improve the relevance of the detected signals. Finally, we hoped to perform a sensitivity analysis of the algorithms by detecting signals across domains, e.g., using a baseline from one disaster-related event to detect signals during a similar event at a different time.